


Viktor Tolmachev, Data Scientist at EPAM, has verified these interview questions and answers. Thanks a lot, Viktor!
Navigating through a data science interview can be a daunting task. Whether you're a seasoned expert or a budding professional, preparing for the interview is crucial. We’ve curated this guide on data science interview questions and answers to help you prepare for your upcoming interview and take up your next data scientist position.
Whether you're the interviewer looking for the right questions to assess a candidate's expertise, or the interviewee wanting to showcase your skills, this guide is your go-to resource. It's like having a solution file for your interview preparation and an idea of how you can freshen your skills to match the requirements on the data scientist job description.
So, let's dive in and explore these data science interview questions and answers together.
save your time on job search
Send your CV and we'll match your skills with our jobs, while you get ready for your next data scientist interview.
Basic data science interview questions and answers
Before you update your CV or resume and open your browser to join that virtual interview, take some time to go through these questions and answers. Understanding these questions will not only help you provide well-structured responses but also demonstrate your proficiency in various data science technologies.
1. Define data science
Data science is an interdisciplinary field leveraging scientific methodologies, processes, and algorithms to garner insights and knowledge from both structured and unstructured data. It incorporates theories and techniques from several domains such as mathematics, statistics, computer science, and information science. Data science is instrumental in making informed decisions and predictions based on data analysis.
2. Explain the concepts of a false positive and a false negative
A false positive refers to an error in binary classification where a test result wrongly indicates the existence of a condition, like a disease, when in reality, the condition is absent. Conversely, a false negative is an error where the test result mistakenly fails to recognize the presence of a condition when it actually exists. These errors hold significant importance in areas like medical testing, machine learning, and statistical analysis.
3. Describe supervised and unsupervised learning and their differences
A supervised learning model is instructed on a dataset that contains both an input variable (X) and an output variable (Y). The model learns from this data and makes predictions accordingly.
Alternatively, unsupervised learning seeks to identify previously unknown patterns in a dataset without pre-existing labels, requiring minimal human supervision. It primarily focuses on discovering the underlying structure of the data.
4. Can you explain overfitting and how to avoid it?
Overfitting is a concept in data science where a statistical model fits the data too well. It means that the model or the algorithm fits the data too well to the training set. It may need to fit additional data and predict future observations reliably. Overfitting can be avoided using techniques like cross-validation, regularization, early stopping, pruning, or simply using more training data.
5. What is the role of data cleaning in data analysis?
Data cleaning involves checking for and correcting errors, dealing with missing values, and ensuring the data is consistent and accurate. With clean data, the analysis results could be balanced and accurate.
6. What is a decision tree?
A decision tree is a popular and intuitive machine learning algorithm which is most frequently used for regression and classification tasks. It is a graphical representation that uses a tree-like model of decisions and their possible consequences. The decision tree algorithm is established on the divide-and-conquer strategy, where it recursively divides the data into subsets considering the values of the input features until a stopping criterion is met.
In a decision tree, each internal node denotes a test on an attribute, which splits the data into two or more subsets based on the attribute value. The attribute with the best split is chosen as the decision node at each level of the tree. Each branch showcases an outcome of the test, leading to a subsequent node in the tree. The process continues until a leaf node is reached, which holds a class label.
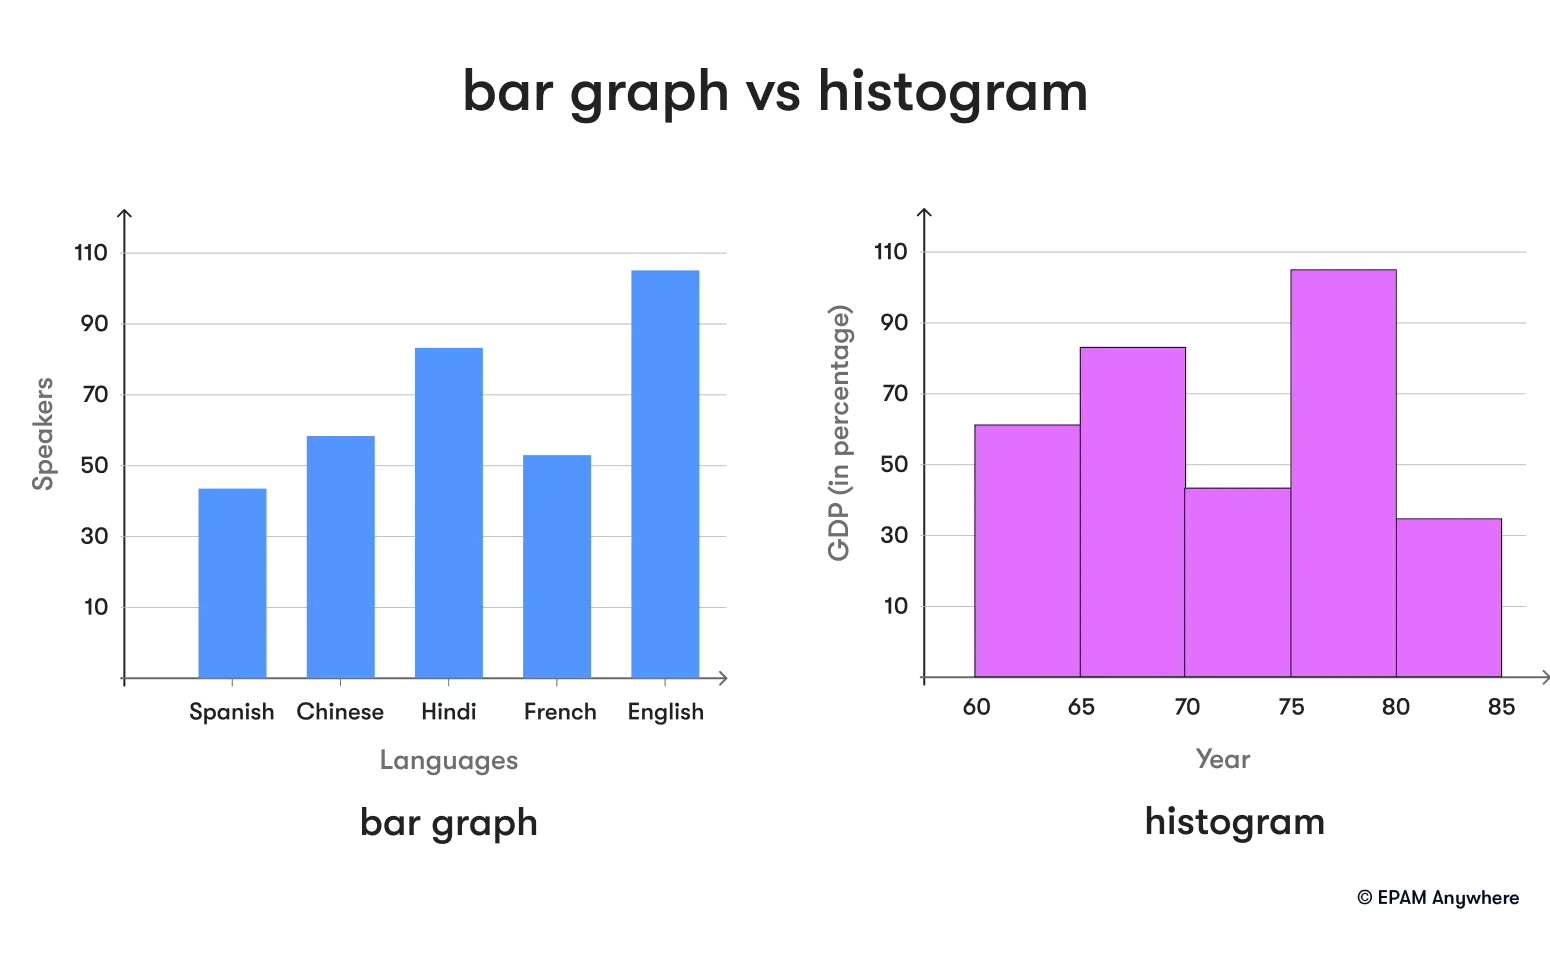
7. Describe the difference between a bar chart and a histogram
A bar chart and a histogram both provide a visual representation of data. A bar chart is used for comparing different categories of data with the help of rectangular bars, when the length of the bar is proportional to the data value. The categories are usually independent. On the other hand, a histogram is used to represent the frequency of numerical data by using bars. The categories in a histogram are ranges of data, which makes it useful for understanding the data distribution.

8. What is the central limit theorem, and why do we use it?
The central limit theorem is a cornerstone principle in statistics that states that when an adequately big number of independent, identically distributed random variables are added, their sum tends toward a normal distribution, not considering the shape of the original distribution. This theorem is crucial because it allows us to make inferences about the means of different samples. It underpins many statistical methods, including confidence intervals and hypothesis testing.
9. Can you explain what principal component analysis (PCA) is?
Principal component analysis (PCA) is a statistical process which converts a set of observations of correlated variables into uncorrelated ones known as principal components. This technique is used to emphasize variation and identify strong patterns in a dataset by reducing its dimensionality while retaining as much information as possible. This makes it easier to visualize and analyze the data, as well as to identify important features and correlations. The principal components are linear combinations of the original variables and are chosen to capture the maximum amount of variation in the data. The first principal component is responsible for the biggest possible variance in the data, with each succeeding component accounting for the highest possible remaining variance while being orthogonal to the preceding components.
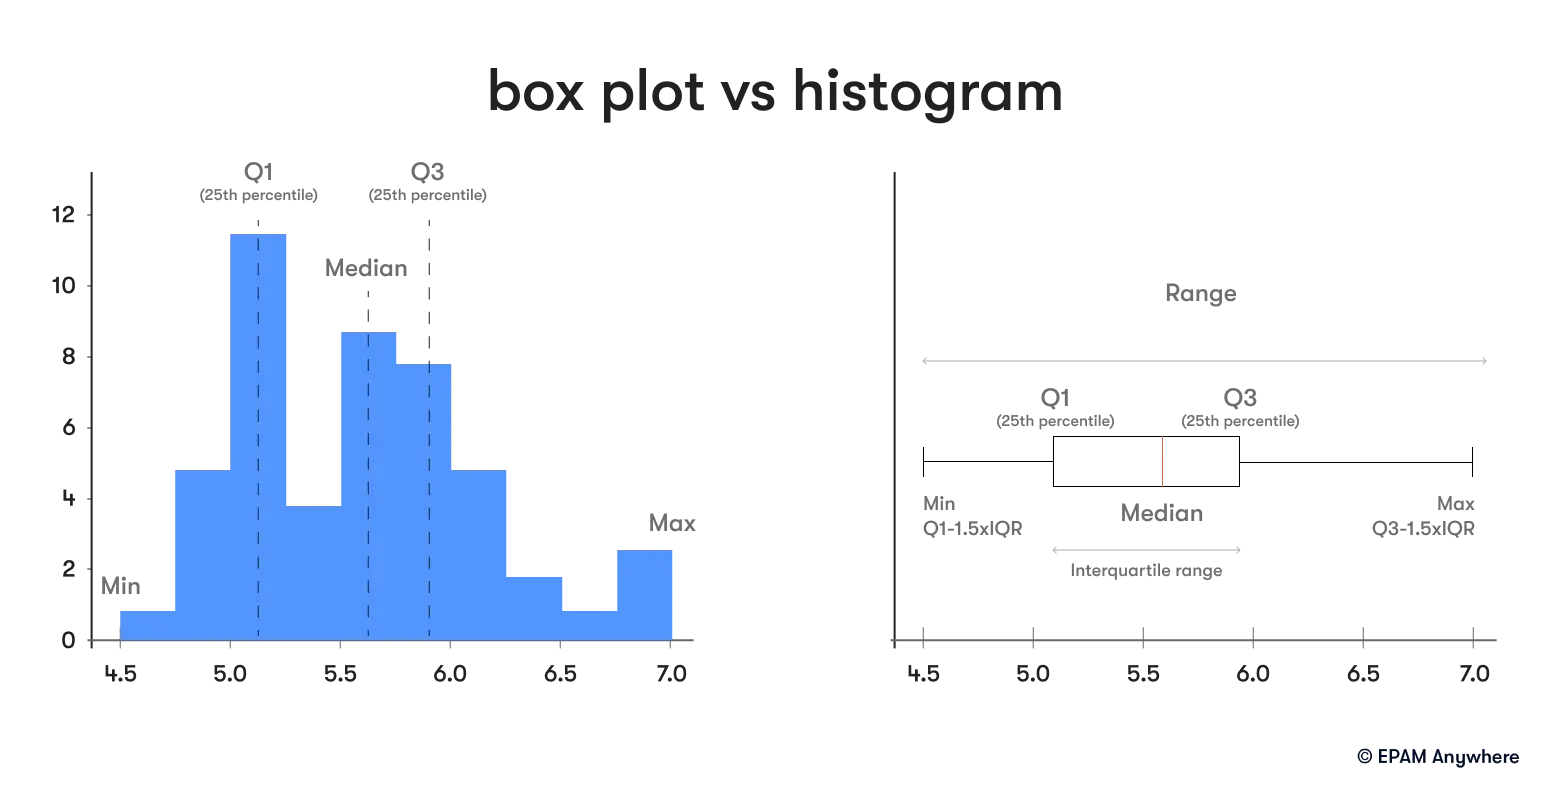
10. Can you describe the difference between a box plot and a histogram?
A box plot and a histogram are both graphical representations of data, but they present data in different ways. A box plot is a method used to depict groups of numerical data graphically through their quartiles, providing a sketch of the distribution of the data. It can also identify outliers and what their values are. On the other hand, a histogram is for plotting the frequency of score occurrences in a continuous dataset that has been divided into classes, called bins.

11. What is the difference between correlation and covariance?
Correlation and covariance are both measures used in statistics to describe the relationship between two variables, but they have some key differences.
Covariance measures the extent to which two variables change together. It indicates the direction of the linear relationship between the variables. A positive covariance means that as one variable increases, the other variable tends to increase as well, while a negative covariance means that as one variable increases, the other variable tends to decrease. However, the magnitude of covariance depends on the scale of the variables, making it difficult to compare covariances between different datasets.
Correlation, on the other hand, standardizes the measure of the relationship between two variables, making it easier to interpret. Correlation coefficients range from -1 to 1, where -1 indicates a perfect negative linear relationship, 0 indicates no linear relationship, and 1 indicates a perfect positive linear relationship. Unlike covariance, correlation is dimensionless and does not depend on the scale of the variables, making it a more reliable measure for comparing relationships across different datasets.
12. Explain what a random forest is
Random forests are a machine learning algorithm consisting of multiple decision trees working together as an ensemble. The algorithm uses a random subset of features and data samples to train each individual tree, making the ensemble more diverse and less prone to overfitting.
One of the advantages of a random forest is its ability to produce class predictions based on the output of each tree, with the final prediction being the class with the majority of votes. The idea behind random forests is based on the notion that multiple weak learners can be combined to form a strong learner, with each tree contributing its own unique perspective to the overall prediction.
13. What is the concept of bias and variance in machine learning?
In machine learning, bias and variance are two crucial concepts that significantly affect a model's prediction error. The concept of bias refers to the error introduced by approximating a highly complex real-world problem using a much simpler model. The degree of bias can vary depending on how much the model oversimplifies the problem, leading to underfitting, which means that the model cannot capture the underlying patterns in the data. High bias means the model is too simple and may not capture important patterns in the data.
On the other hand, variance refers to the error introduced by the model's complexity. A model with high variance overcomplicates the problem, leading to overfitting, which means the model becomes too complex and captures the noise in the data instead of the underlying patterns. High variance means the model is too sensitive to the training data and may not generalize well to new, unseen data.
Finding the right balance between variance and bias is crucial in creating an accurate and reliable model that can generalize well to new data.
14. Can you explain what cross-validation is?
Cross-validation is a powerful and widely used resampling technique in machine learning that is employed for assessing a model’s performance on an independent data set and to fine-tune its hyperparameters. The primary objective of cross-validation is to prevent overfitting, a common problem in machine learning, by testing the model on unseen data.
A common type of cross-validation is k-fold cross-validation, that involves dividing the data set into k subsets, or folds. The model is later trained on k-1 folds, and the remaining fold is used as a test set to evaluate the model's performance. This process is repeated k times, with each fold used exactly once as a test set.
The primary advantage of k-fold cross-validation is that it provides a more accurate and robust estimate of the model's true performance than a single train-test split.
Overall, cross-validation is an essential tool in the machine learning practitioner's toolkit as it helps avoid overfitting and improves the reliability of the model's performance estimates.
15. Describe precision and recall metrics, and their relationship to the ROC curve
Precision and recall are two critical metrics used in evaluating the performance of a classification model, particularly in situations with imbalanced classes. Precision measures the accuracy of the positive predictions. In other words, it is the ratio of true positive results to all positive predictions (i.e., the sum of true positives and false positives). This metric answers the question, "Of all the instances classified as positive, how many actually are positive?" Recall, also known as sensitivity or true positive rate, measures the ability of the classifier to find all the positive samples. It is the ratio of true positive results to the sum of true positives and false negatives. This means it answers the question, "Of all the actual positives, how many did we correctly classify?"
The relationship between precision and recall is often inversely proportional; optimizing for one metric may lead to a decrease in the other. This trade-off is visualized effectively using a Receiver Operating Characteristic (ROC) curve, which plots the true positive rate (recall) against the false positive rate. Another related tool is the Precision-Recall curve, directly plotting precision against recall for various thresholds. While the ROC curve is useful in many contexts, the Precision-Recall curve provides a more informative picture in cases of highly imbalanced datasets.
Senior data scientist interview questions
16. Explain feature engineering and its importance in machine learning
Feature engineering is the transforming raw data into features that better represent the underlying problem to the predictive models, resulting in improved model accuracy. It involves techniques such as imputation, handling outliers, binning, log transform, one-hot encoding, grouping operations, feature split, scaling, extracting date, and others.
The right features can simplify complex models and make them more efficient, improving the performance of machine learning algorithms. It's often said that coming up with features is difficult, time-consuming, requires expert knowledge, and is one of the applied machine learning's 'dark arts'.
17. Describe how you would handle missing or corrupted data in a dataset
Handling missing or corrupted data in a dataset is a crucial step in the data cleaning process. There are several strategies to deal with missing data, the choice of which largely depends on the nature of our data and the missing values. We could ignore these rows, which is often done when the rows with missing values are a small fraction of the dataset.
We could also fill them in with a specified value or an average value, or use a model to predict the missing values. For corrupted data, it's important to first identify them using exploratory data analysis and visualization tools, and then decide on the best strategy for handling them, which could range from correcting the errors if they're known to removing the corrupted data.
18. Can you explain the difference between a Type I and a Type II error in the context of statistical hypothesis testing?
In statistical hypothesis testing, the null hypothesis serves as the default assumption about the population being studied. It suggests that there is no significant effect or relationship present in the data.
A Type I error occurs in case the null hypothesis is true but is rejected. It represents a "false positive" finding.
On the other hand, a Type II error is recorded when the null hypothesis is false, but is erroneously not rejected. It represents a "false negative" finding.
For example, consider a medical diagnosis scenario:
A Type I error would be if a test wrongly concludes that a patient has a disease when they actually don't (false positive). For instance, a person might be mistakenly diagnosed with cancer when they are healthy.
A Type II error would occur if the test fails to detect the presence of a disease when the patient actually has it (false negative). For example, a patient might be incorrectly diagnosed as healthy when they do have cancer.
The potential for these errors exists in every hypothesis test, and part of the process of designing a good experiment includes attempts to minimize the chances of both Type I and Type II errors.
19. Describe how you would validate a model
Model validation can be achieved through various techniques such as holdout validation, cross-validation, and bootstrapping.
In holdout validation, we split the data into a test and a training set. The model is trained on the training set and validated on the test set.
In cross-validation, the data is split into 'k' subsets and the holdout is repeated 'k' times. A test set is derived from one of the 'k' subsets and a training set is derived from the other 'k-1' subsets. To calculate the total effectiveness of our model, we average the error estimation over all k trials.
In bootstrapping we repeatedly sample observations from the dataset with replacement, building models on each sample, and evaluating their performance.
The choice of technique depends on the characteristics of your dataset. If you have a large dataset readily available, holdout validation can be a swift option. For smaller datasets where maximizing data utilization is crucial, cross-validation is preferred. In cases where data is limited or irregularly distributed, bootstrapping can provide robust estimates of model performance.
20. Please explain the concept of deep learning and how it differs from traditional machine learning
Using representation learning and artificial neural networks, deep learning is a highly advanced subset of machine learning. It requires less data preprocessing by humans, which makes it more efficient and effective. Additionally, it can often produce more accurate results than traditional machine learning models, especially in advanced tasks like image recognition and speech recognition.
The distinction between deep learning and machine learning algorithms lies in their structure. While traditional machine learning algorithms are linear and straightforward, deep learning algorithms are stacked in a hierarchy of increasing complexity and abstraction. This structure allows deep learning algorithms to learn from large amounts of data, identify hidden patterns, and make predictions with high accuracy.
21. What is your experience with data scaling and how do you handle variables that are on different scales?
Data scaling is used to standardize the range of features of data since different magnitude scales can be problematic for numerous machine learning algorithms. Common methods for scaling include normalization and standardization. Normalization scales numeric variables in the range of [0,1]. One possible method of normalization subtracts the minimum value of the feature and then divides by the range. Standardization converts data to have a mean of zero and a standard deviation of 1. This standardization provides a level playing field for all features to have the same effect on the total distance.
22. Explain the concept of "ensemble learning" and provide an example of this technique
Ensemble learning combines multiple models to solve a single problem more effectively than any individual model. The idea behind ensemble learning is that a group of weak learners can be brought together to form a strong learner. Each model in the ensemble is trained on a different set of data or uses a different algorithm, so it is able to capture different aspects of the problem. The final prediction of the model is defined by a majority vote, where each model makes a vote.
An example of an ensemble learning algorithm is the Random Forest algorithm. Random Forest is established on a decision tree ensemble learning that constructs multiple decision trees and outputs the class being the mode of the classes output by individual trees. This approach has several advantages over using a single decision tree, such as being less prone to overfitting and having higher accuracy.
23. How do you ensure you're not overfitting with a model?
Overfitting happens when a model learns the specifics and noise in the training data so much that it adversely affects its performance on new data. To avoid overfitting, you can use techniques such as cross-validation where the fit of the model is validated on a test set to ensure it can generalize to unseen data.
An adequate amount of data available for training is essential as well. More data allows the model to learn from a diverse range of examples, helping it to generalize better to unseen data.
Regularization techniques, such as L1 or L2 regularization, can help prevent overfitting by penalizing overly complex models. These techniques add a penalty term to the model's cost function, discouraging the model from fitting too closely to the training data.
Finally, monitoring the model's performance on the validation set during training is essential. Early stopping can be implemented to halt training when the model's performance begins to degrade, preventing it from fitting too closely to the training data.
24. What is your experience with Spark or big data tools for machine learning?
Apache Spark's MLlib library provides several machine learning algorithms for classification, regression, clustering, and collaborative filtering, as well as model evaluation and data preparation tools. Spark is particularly useful when working with big data due to its ability to handle large data volumes and perform complex computations efficiently.
25. Explain A/B testing and how it can be used in data science
A common method for comparing two versions of a web page or user experience to find out which one performs better is called A/B testing, also known as split testing. It involves testing changes to a webpage against its current design to determine which one produces better results. In the field of data science, A/B testing is typically used to test hypotheses about different strategies or changes to a product, and to determine which strategy is more effective. By using statistical analysis, A/B testing helps validate changes and improvements made to a product or experience.
26. How would you implement a user recommendation system for our company?
Implementing a user recommendation system involves several steps. First, we need to collect and store user data, including user behavior and interactions with products. This data can be used to identify patterns and make recommendations.
There are various types of recommendation systems, including collaborative filtering, content-based filtering, and hybrid systems. Collaborative filtering recommends products based on similar user behavior, while content-based filtering recommends products that are similar to those a user has liked in the past. A hybrid system combines both methods. The choice of system depends on the specific needs and context of the company.
27. Can you discuss a recent project you’ve worked on that involved machine learning or deep learning? What were the challenges and how did you overcome them?
A sample answer that you can use as a template to add in the details of your recent project:
“In a recent project, the task was to predict customer churn for a telecommunications company using machine learning. The primary challenge encountered was the imbalance in the data, as the number of churned customers was significantly lower than the retained ones. This imbalance could potentially lead to a model that is biased towards predicting the majority class. To address this, a combination of oversampling the minority class and undersampling the majority class was employed to create a balanced dataset. Additionally, various algorithms were tested and ensemble methods were utilized to enhance the model's predictive performance. The model was subsequently validated using a separate test set and evaluated based on its precision, recall, and AUC-ROC score. This project underscored the importance of thorough data preprocessing and careful model selection when dealing with imbalanced datasets.”

Lead data scientist interview questions
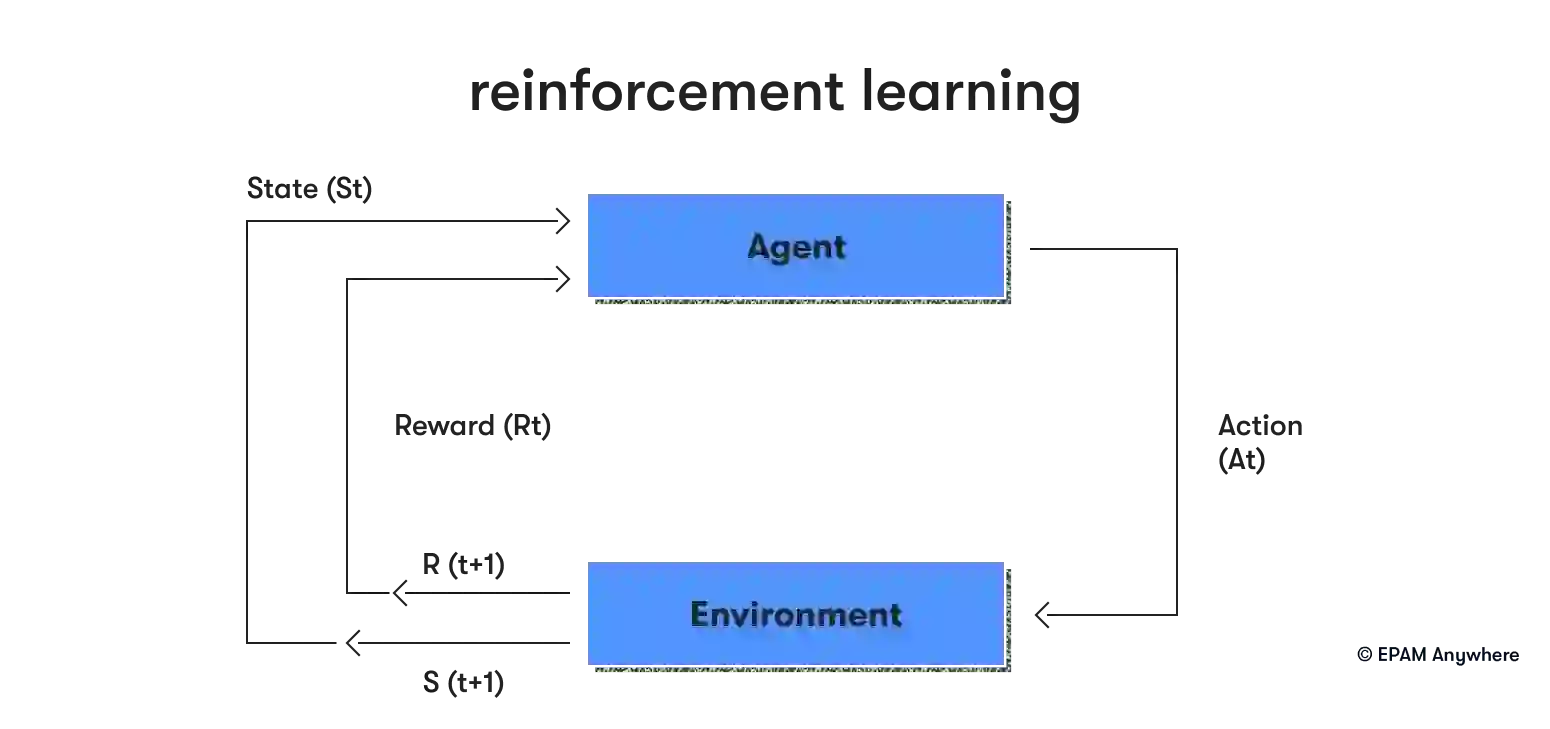
28. Can you explain the concept of reinforcement learning and how it differs from supervised and unsupervised learning?
Reinforcement learning is when an agent learns to make decisions by interacting with its environment. The "agent" refers to the entity or system that is responsible for making decisions and taking actions within an environment. The agent performs certain actions and gets rewards or penalties in return. Over time, the agent learns to make the best decisions to maximize the total reward. This is different from supervised learning, where the model learns from a labeled dataset, and unsupervised learning, where the model finds patterns in an unlabeled dataset. In reinforcement learning, there's no correct answer to learn from, but instead, the model learns from the consequences of its actions.
29. How would you approach the problem of anomaly detection in large datasets?
Anomaly detection in large datasets can be approached in several ways. One common method is statistical anomaly detection, where data points that deviate significantly from the mean, median or quantiles might be considered anomalies. Another method is machine learning-based, where a model is trained to recognize 'normal' data, and anything that deviates from this is considered an anomaly. This could be done using clustering, classification, or nearest neighbor methods. The choice of method depends on the nature of the data and the specific use case.
30. Can you discuss the concept of neural networks and how they are used in deep learning?
Neural networks are algorithms modeled loosely after the human brain, designed to recognize patterns. They interpret sensory data through a type of machine perception, labeling or clustering raw input. In deep learning, neural networks create complex models that allow for more advanced capabilities. These networks consist of numerous layers of nodes (or "neurons"), with each layer learning to transform its input data into an abstract and composite representation. The layers are hierarchical, with each layer learning from the one before it. The depth of these networks is what has led to the term "deep learning".
want to work with the latest tech?
Join EPAM Anywhere to revolutionize your project and get the recognition you deserve.
31. What is your experience with handling and analyzing big data? What tools and frameworks have you used?
Handling and analyzing big data involves dealing with data sets that are too large for traditional data-processing software to deal with. This requires the use of specialized tools and frameworks. Some of the commonly used tools include Apache Hadoop to store and process large data sets, Apache Spark to perform big data processing and analytics, and NoSQL databases like MongoDB for storing and retrieving data. Other tools like Hive and Pig can also be used for analyzing big data.
32. Can you explain the concept of natural language processing (NLP) and its applications in data science?
NLP is a subdivision of AI that focuses on the communication between humans and computers using natural language. The primary goal of NLP is to interpret, comprehend, and extract valuable insights from human language. NLP is widely used in data science for various tasks, including sentiment analysis, which involves using machine learning techniques to classify a piece of text as positive, negative, or neutral, and text classification, where text documents are automatically categorized into predefined groups.
33. How do you ensure data security and privacy when working on data science projects?
Ensuring data security and privacy in data science projects involves several steps. First, data should be anonymized or pseudonymized to protect sensitive information. This can involve removing personally identifiable information (PII) or replacing it with artificial identifiers. Second, data should be encrypted in transit and at rest to eliminate unauthorized access. Access to data should be controlled using appropriate authentication and authorization mechanisms. Finally, data privacy regulations, such as the General Data Protection Regulation (GDPR), should be followed to ensure legal compliance.
34. Can you explain the concept of transfer learning in the scope of machine learning and deep learning?
Transfer learning is an approach used in machine learning that involves using a pre-existing model to solve a new problem. This approach is implemented in deep learning for tasks involving computer vision and natural language processing, where pre-trained models can serve as a starting point. Transfer learning is most effective when the datasets used to solve the original problem and the new problem are similar. Instead of building a new machine-learning model from scratch to solve a similar problem, the existing model developed for the original task can be repurposed as a starting point.
For example, transformer-based models (like BERT) pre-trained on multiple languages can be fine-tuned to specialize in specific language pairs or domains, improving the quality of the target task.
35. What is your approach to designing and implementing machine learning pipelines?
Designing and implementing machine learning pipelines involves several steps. First, the problem needs to be clearly defined and understood. Next, the data is collected, cleaned, and preprocessed. This can involve dealing with missing values, outliers, and categorical variables.
The data is then split into training test sets. This model is trained on the training set and evaluated by the test set. The model may need to be tuned to improve its performance. Once the model is performing well, it can be deployed and used to make predictions on new data.
36. Can you discuss the challenges and solutions of working with imbalanced datasets?
Dealing with imbalanced datasets can pose a difficult task since traditional machine learning algorithms tend to expect an even distribution of data instances for all classes. However, when this assumption fails to hold true, the models may end up being inclined towards the majority class and as a result may not perform well on the minority class.
One approach is to balance the dataset by undersampling the majority class or by oversampling the minority class. Another approach is to use different performance metrics, such as precision, recall, F1 score, or the area under the ROC curve, that take into account both the positive and negative classes. Finally, some machine learning algorithms allow for the use of class weights, which can be set to be inversely proportional to class frequencies.
37. How do you approach feature selection when preparing data for machine learning models?
Feature selection is a crucial step in preparing data for machine learning models. It involves selecting the most useful features or variables to include in the model. This can be done using various methods, such as correlation matrices, mutual information, or using machine learning algorithms like decision trees or LASSO that inherently perform feature selection. The goal is to remove irrelevant or redundant features that could potentially harm the model's performance.
38. Can you explain the time series analysis concept and its applications in data science?
Time series analysis involves analyzing data that is gathered over time to identify patterns, trends, and seasonality. This can be used to forecast future values. In data science, time series analysis is used in many fields. For example, in finance, it can be used to forecast stock prices. In marketing, it can be used to predict sales. This method of analysis can also be used to predict disease outbreaks. Time series analysis requires specialized techniques and models, such as ARIMA and state space models, that take into account the temporal dependence between observations.
39. What is your experience with cloud platforms for data science, such as AWS, Google Cloud, and Azure?
Cloud platforms like AWS, Google Cloud, and Azure provide powerful tools for data science. They offer services for big data analytics, machine learning, artificial intelligence, and more. These platforms provide scalable compute resources on demand, which is particularly useful for training large machine learning models and processing large datasets. They also provide managed services for data storage, data warehousing, and data processing, which can save time and resources compared to managing these services in-house.
Product data scientist interview questions and answers
40. How would you use data science to improve a product's user experience?
Through analysis of user behavior data, data scientists can gain valuable insights on how users interact with the product and identify improvement areas. For instance, if users tend to abandon the product at a specific point, this could indicate a problem that needs to be addressed. Additionally, data science can help personalize the user experience.
You can customize the product to meet the unique user needs by using machine learning algorithms to analyze user behavior and preferences. This may involve providing personalized recommendations for products or content or tailoring the user interface to suit individual preferences.
41. How would you use A/B testing to test changes to a product?
When evaluating the effectiveness of a product or feature, A/B testing is a popular method that involves comparing two versions and determining which one performs better. This is achieved by showcasing the two versions to different groups of users and using statistical analysis to determine which version is more effective. Before utilizing A/B testing you should initially define key metrics aligned with the product's objectives, such as conversion rate, retention rate, or revenue.
For instance, when testing a redesign of a mobile app's onboarding flow, you can closely monitor metrics like user sign-up rate, completion of onboarding steps, and user retention after onboarding to assess the redesign's effectiveness in enhancing user acquisition and retention.
42. Can you discuss when you used data science to solve a product-related problem?
A sample answer:
“In a recent scenario, data science was leveraged to tackle a high attrition rate for a digital service. By scrutinizing user behavior data, patterns and trends were identified among users who had discontinued the service. The analysis revealed that many users were leaving due to a particular feature that was not user-friendly. Armed with this insight, the product team redesigned the feature to enhance its usability, substantially reducing the attrition rate. This instance underscored the power of data science in identifying issues and informing solutions to enhance product performance and user satisfaction.”
43. How would you use predictive modeling to forecast product sales?
Predictive modeling can be used to forecast product sales by using historical sales data to predict future sales. This can be implemented with various machine learning techniques, such as regression models, time series analysis, or even deep learning models. The model would be trained on a portion of the historical data and then tested on the remaining data to evaluate its performance. The model could then be used to forecast future sales. It's important to note that various factors, such as seasonal trends, market conditions, and the introduction of new products can influence the accuracy of the forecast.
44. How would you use data science to identify and understand a product's key performance indicators (KPIs)?
Data science can be used to identify and understand a product's key performance indicators (KPIs) by analyzing data related to the product's usage and performance. This could involve analyzing user behavior data to understand user interaction patterns or sales data to understand the products’ market performance.
Suppose a mobile app is being worked on. Utilizing data science techniques, user engagement metrics like daily active users (DAU), retention rate, and in-app purchase frequency can be analyzed. Through exploratory data analysis, you can discover, for example, a strong correlation between user engagement and the number of daily notifications sent by the app. Based on this insight, you can prioritize "notification engagement rate" as a KPI, with the aim to optimize notification strategies to drive user engagement and retention. This metric can then be monitored and analyzed continuously to understand how the product is performing and where improvements can be made.
45. How would you personalize a product's user experience using machine learning?
By analyzing the behavior and preferences of a user, machine learning algorithms can adjust the product to cater to the individual needs of each user. This could include suggesting products or content based on a user's previous activity or customizing the user interface to emphasize features that a particular user frequently uses. Through such personalized experiences, machine learning can significantly boost user engagement and satisfaction.
For example, a streaming platform could use machine learning algorithms to build a recommendation system to recommend movies and TV shows based on a user's viewing history and ratings, thereby enhancing the overall user experience.
46. How would you use data science to identify product expansion or improvement opportunities?
Data science helps identify opportunities for product expansion or improvement by analyzing product performance and usage data. For example, by analyzing sales data, data science can identify which features or aspects of the product are most popular with customers.
This could indicate areas where the product could be expanded. Similarly, by analyzing user behavior data, data science can identify features that are not being used or causing users frustration. This could indicate areas where the product could be improved. By providing these insights, data science can help to guide product development and ensure that resources are being focused in the right areas.
47. Can you explain how you would use machine learning to improve the accuracy of predictive models over time?
Predictive models can benefit greatly from machine learning, especially when it comes to improving accuracy over time. Machine learning algorithms can learn from data, meaning they can adapt to new information and changes in trends. To enhance predictive model accuracy over time using machine learning, we can leverage techniques such as continual learning and active learning. Continual learning ensures the model adapts to evolving patterns by regularly updating with new data. Active learning optimizes the learning process by selectively labeling the most informative data points, maximizing efficiency in model training and improving accuracy with fewer labeled examples. These iterative approaches refine the model's understanding of the data and enable it to stay relevant and accurate over time.
48. How would you use data science to optimize a product's pricing strategy?
Data science can play a crucial role in optimizing a product's pricing strategy. Here's how:
- Price elasticity modeling: Data science can be used to create models that estimate how demand for a product changes with different price points. This concept, known as price elasticity, can help identify the optimal price that maximizes revenue or profit.
- Competitor pricing analysis: Data science techniques can be used to analyze competitor pricing data and understand where a product stands in the market. This can inform whether a product should be positioned as a cost-leader or a premium offering.
- Customer segmentation: Machine learning algorithms can segment customers based on their purchasing behavior, preferences, and sensitivity to price. Different pricing strategies can be applied to different segments to maximize overall revenue.
- Dynamic pricing: Data science can enable dynamic pricing strategies where prices are adjusted in real time based on supply and demand conditions. This is commonly used in industries like airlines and e-commerce.
- Predictive analysis: Predictive models can forecast future sales under different pricing scenarios. This can inform pricing decisions by predicting their impact on future revenue.
49. Can you discuss how you would use data science to analyze and improve a product's user retention?
Data science can be used to analyze and improve a product's user retention by examining user behavior data. This could involve identifying patterns or characteristics of users who continue to use the product over time and those who stop using the product. Metrics such as frequency of logins, time spent on the platform, number of interactions (e.g., clicks, views, likes), demographic information and session duration provide valuable insights into user engagement.
Machine learning algorithms can help predict which users are most likely to churn, allowing for proactive measures to improve retention. By understanding the factors influencing user retention, data science can inform strategies to improve the user experience and increase loyalty.
For example, a music streaming service could use predictive models to identify users at risk of churning and offer them personalized playlists or discounts on premium subscriptions to encourage continued usage.
50. How would you use data science to conduct a competitive product analysis?
Data science can be used to conduct a competitive product analysis by collecting and analyzing data on competitor products. This could involve analyzing data on product features, pricing, customer reviews, and market share. Utilizing techniques like natural language processing (NLP) can aid in sentiment analysis of customer reviews, employing clustering algorithms to discern similarities and differences between products. Furthermore, regression analysis can help understand the impact of pricing on the market share.
Data science can inform strategic decisions about product development, pricing, and marketing by understanding how the product compares to competitors.


With a focus on remote lifestyle and career development, Gayane shares practical insight and career advice that informs and empowers tech talent to thrive in the world of remote work.
With a focus on remote lifestyle and career development, Gayane shares practical insight and career advice that informs and empowers tech talent to thrive in the world of remote work.
Explore our Editorial Policy to learn more about our standards for content creation.
read more


