


When you need to gauge the usability of a design and market viability, quantitative testing lets you eliminate the guesswork. Quantitative data involves concrete metrics, making it a crucial methodology for analyzing the user experience to improve UX design without the need for assumptions.
By using quantitative testing, achieving success with new product development is simpler. Here’s what you as a product manager need to know about quantitative research, including what it is, how it differs from qualitative user testing, and more.
What is quantitative testing?
Quantitative testing is one of two primary research methods that allow a company to observe user behavior trends within a target audience to ensure market viability and a sound return on investment (ROI). Quantitative methods are metric-driven, ensuring that any collected data is quantifiable. However, quantitative usability testing also relies on in-person user interaction, allowing them to directly engage with the product or service to observe patterns, identify pain points, analyze task completion rates, and guide future iterations to improve success rates.
Prototype testing is a crucial part of the equation, particularly when quantitative testing is used as part of the UX research and design process. However, a range of other testing methods is also beneficial. Quantitative studies can include in-depth questionnaires, moderator-led focus groups, and other testing tools that assess a user’s actions and perspective to gather information connected to preselected KPIs relating to product or service viability.
Quantitative user testing also involves a larger sample size when compared to some alternatives. While this can make it more costly and time-consuming, it assists with service and product design by providing a greater degree of trend-based data collection. It ensures that target audience personas are thoroughly represented during usability studies, decreasing the odds that critical behavior trends or usability problems are accidentally overlooked during the design process, thus leading to a better final outcome.
Quantitative vs qualitative testing

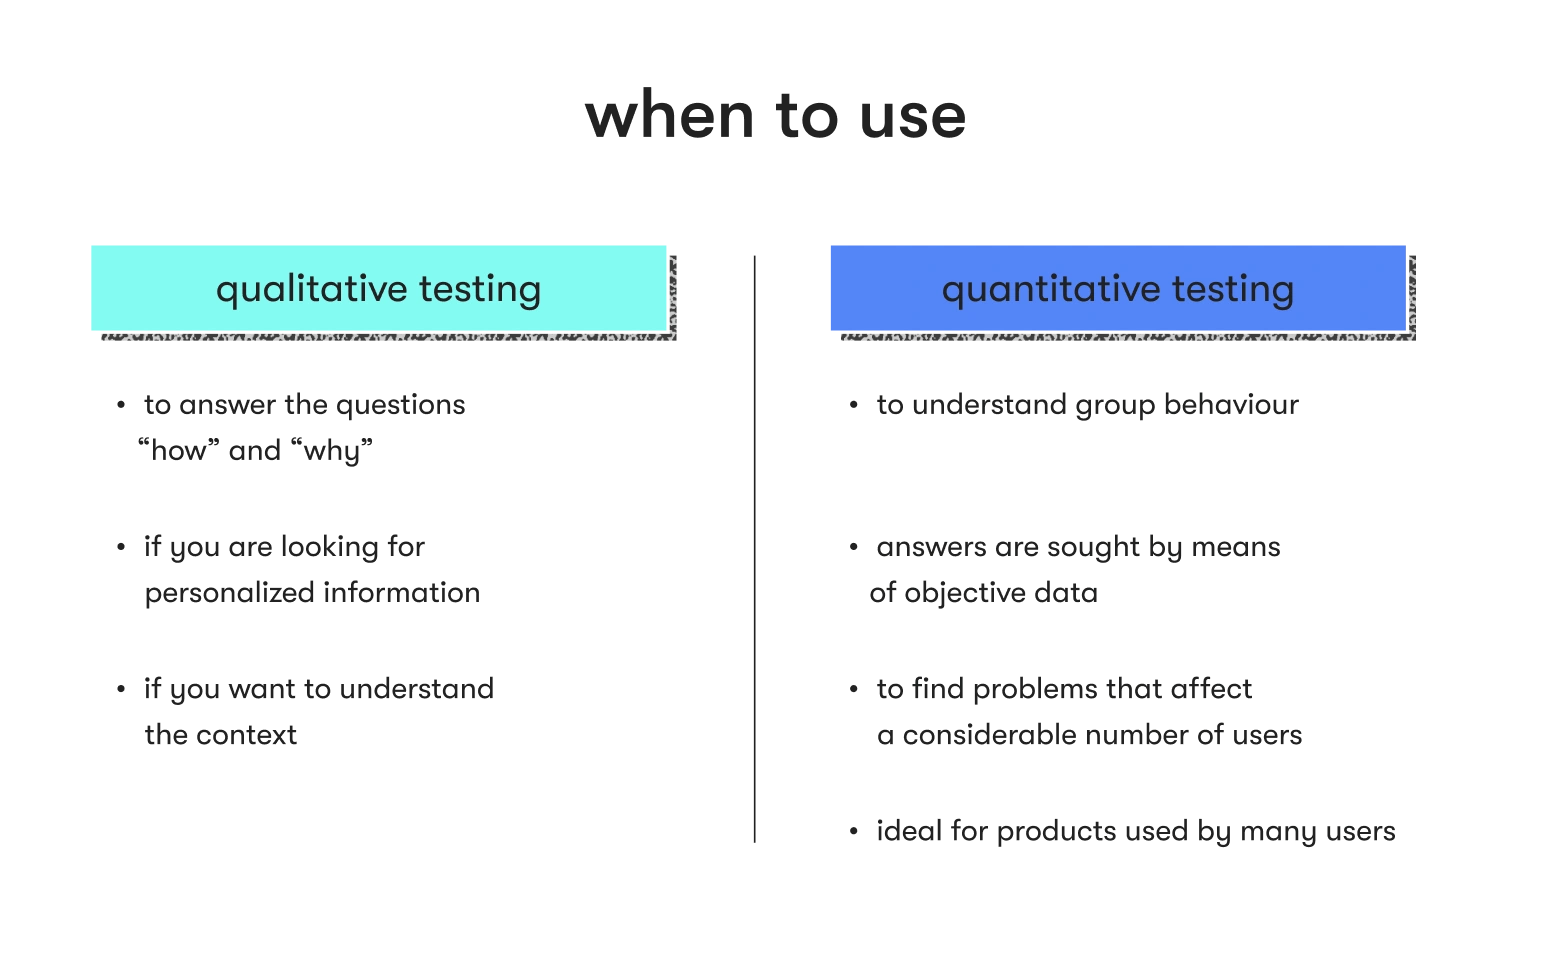
When it comes to qualitative vs. quantitative testing, qualitative data focuses more on the individual. It considers why a specific user took a particular action, factoring in emotional responses and personal perception. Additionally, comments and feedback from each user are part of qualitative usability testing, and qualitative research also includes insights from researchers or stakeholders in regard to how product feedback is interpreted.
Compared to qualitative methods, quantitative testing is group-oriented and statistics-driven. While feedback is often gathered, the goal is to identify broader trends to produce numerical data for analysis. For example, feedback may involve multiple-choice surveys over essay-style responses, as the former strategy leads to metrics. When it comes to assessing specific tasks, completion time and rates, the number of errors or misclicks, and similar points are considered.
Further, quantitative user research assists with validating design decisions and identifying usability issues by considering the actions of all participants, essentially focusing on larger segments of the target audience. It often involves unmoderated testing that favors automatic data collection methods and ensures the information gathered isn’t open to interpretation by those collecting or reviewing it. However, moderated approaches can also provide value.
ready to build your dream career?
Don't wait any longer and pursue your dream career today. Send your CV and our team will match your skills with the best jobs at EPAM Anywhere.
8 types of quantitative testing
Overall, it’s possible to break down quantitative testing in several ways. Some focus on moderated vs. unmoderated options, particularly since the former comes with extra tasks like creating a usability test script. However, it’s better to get into more depth, as there is a wide array of potential techniques to use to successfully collect the necessary types of data.
Whether a company is creating an entirely new product or service or is focused on a redesign for an existing solution, employing the right strategies is essential. Here’s a closer look at eight different types of quantitative testing.
1. A/B testing
A/B testing is a type of quantitative testing that focuses on comparing two design options. Two versions of the same UI are created, and each one is presented to a different group of users. The users then engage with the prototype presented, but both sets are given the same preset tasks. As they use the product or service, data regarding their performance is collected, allowing for a direct comparison of the two designs.
Essentially, companies can determine whether one design leads to greater user efficiency by examining the KPI data collected from both user groups. Then, the designs can be assessed as a whole, or each individual feature can be analyzed separately to determine which version yields the highest success rates in regard to the various tasks.
2. Surveys
Surveys are a classic form of quantitative testing, as they’re often simple to administer, and results are easy to analyze. Multiple-choice answers create clear statistics, allowing companies to identify trends within the target audience.
With surveys, it’s also possible to combine quantitative and qualitative analysis. By adding essay response questions, researchers can learn why a user gave a particular answer. Additionally, the responses can be analyzed for keywords they have in common, which could lead to more statistical information.
3. Usability benchmarking
Usability benchmarking is a type of quantitative testing that involves having users complete realistic tasks using the service or product. It focuses on specific KPIs, such as completion time and rates.
The goal is to establish baselines early in product or service development. Then, as improvements are made, the usability tests are repeated, allowing companies to determine if each iteration is leading to greater success rates or shorter times to finish the various tasks.
For example, while usability benchmarking doesn’t dig into the “why” behind various challenges users encounter, it does help with the identification of design flaws. Issues like misclicks or failing to complete certain tasks show that there’s something ambiguous about the UX design, causing users to struggle to handle a task as the company intends. At that point, the design team can look for opportunities to enhance usability by making the product or service more intuitive before retesting.
Additionally, usability benchmarking makes it easier to compare a product or service to competitor offerings. Essentially, it creates an opportunity to assess if users are more efficient by using one solution over the other. If a company’s task completion times or success rates are behind a competitor’s, it shows that further improvements are necessary to make the service or product competitive within the marketplace.
4. Card sorting
Card sorting is a form of quantitative testing that often occurs earlier in the UI design process. Users are given a set of cards and asked to categorize them. For example, they might be given cards with the names of various features and asked to place them under sections representing the names of planned drop-down menus.
With card sorting, the goal is to assess how users interpret the categories and information presented on the card. During testing, it can reveal issues with labeling that indicate user confusion. Additionally, it can show how users believe that information should be sorted within a product or service, making it easier to determine whether a particular choice is intuitive to those engaging in the test.
While card sorting is often based on the user’s feelings and perspective, by having a large sample size, it’s possible to identify broader patterns and generate statistics. For example, if a high percentage of users categorize a card the same way, it shows a trend in the majority. If a card isn’t primarily categorized similarly, it indicates a potential issue with understanding the categories or labels, creating a point for further investigation.
5. App and web analytics
One of the more passive types of quantitative testing, app and web analytics collect data as users engage with a live product. The solutions assess where users go, how they go there, how they interact with the product or service, and when they leave.
By reviewing the collected data, it’s possible to identify pain points, low-performing content, UI challenges, underutilized features, and other issues that are worth addressing.
6. Heatmapping
Heatmaps are a type of study that shows how users physically engage with a product or service. It relies on a color scale, with red representing high levels of activity and blue representing less popular areas. By analyzing a heatmap, it’s possible to see whether users are overlooking areas with important information. In turn, that could prompt UX/UI design improvements to ensure that essential features are engaged with in future iterations.
In some cases, heatmaps can also highlight where users are functionally disengaging. By comparing heatmaps to app and web analytics data, it’s possible to pinpoint whether specific product or service features are potentially driving users away, which is highly valuable.
7. Eye tracking
An eye-tracking study lets companies assess how the user’s view shifts as they engage with the product or service. Essentially, it identifies sections that catch the user’s attention almost on an instinctive level. Additionally, it can show where they glance when trying to complete a particular task, highlighting where users expect to see specific features within the broader design.
With eye tracking, it’s possible to determine if a specific feature needs more or less emphasis. Additionally, it can help identify areas where users believe an element should be, allowing for UI/UX design improvements that feel more intuitive.
8. Tree testing
Tree testing is often used early in the design phase to assess the overall structure of an application or website. Users are only presented with the categories and subcategories and are asked to complete a task. Then, they generate data regarding the intuitiveness of a design.
Long time-to-completion metrics or lower success rates indicate that the position of a subcategory isn’t in an area where users expect. In contrast, shorter completion metrics and higher success rates suggest that a design is highly usable.

Advantages of quantitative testing
The benefits of quantitative testing are numerous. First, quantitative approaches typically produce more reliable data. Often, they rely on larger sample sets, which increases the odds that the target audience is well-represented. Additionally, it’s possible to verify previous results with more testing, which further ensures that any drawn conclusions are valid.
Quantitative testing is also relatively concrete in nature. It relies heavily on metrics for analysis, leaving less space for interpretation by researchers or stakeholders. Essentially, the data is reasonably objective. Plus, it’s easier to work with than qualitative data.
Performing quantitative tests can also show a company’s expertise. It’s data-driven and scientific-style research, which can make any resulting findings more respected by a larger community.
Often, quantitative research is faster than qualitative alternatives, particularly since some metrics are automatically capturable by specific analysis-oriented technology solutions. For example, web and app analytics are relatively passive from a collection standpoint. Similarly, surveys only require the initial setup, as the data is collected by the underlying solution once a survey is published.
In many cases, quantitative research is often more cost-effective. Many of the techniques are unmoderated, which eliminates the need to cover the cost of moderators. Plus, most are remote-ready, so participating users don’t necessarily need to travel to a company’s facilities to engage with the product or service, take part in surveys, or otherwise provide valuable insights.
Disadvantages of quantitative testing
While quantitative strategies come with many benefits, there are also drawbacks to quantitative testing. Often, it focuses on broader patterns instead of unique user experiences. As a result, if a single participant happens to engage with a prototype in an unconventional way, revealing a clear problem, their experience may get overlooked since it’s outside of the norm.
Quantitative testing also requires objectivity when designing the tests. If a researcher or stakeholder has a specific result in mind, they may accidentally or intentionally position the experience to prove or disprove a particular point because that’s what they want to see. Additionally, any assumptions about the target audience can cause bias to enter into the tests, leading to inaccurate results.
In some cases, quantitative research prevents users from giving a genuine answer to a question. For example, if survey question response choices are highly limited, there might not be an option that reflects a user’s actual thoughts on the matter. Instead, they may get shoehorned into claiming a particular position even if it doesn’t truly align with their perspective, which can prevent the results from accurately reflecting user sentiment.
Finally, using a quantitative method can mean missing out on key details — namely, the “why” behind what drove a user’s decisions. As a result, even a pattern of behavior may not lead to the best design decisions down the line, as those updating the UI could end up making assumptions regarding why the trend developed.
Often, it’s possible to offset any of the limitations of quantitative testing by incorporating qualitative methods. By doing so, researchers can ask follow-up questions during subsequent testing sessions to fill in the blanks, leading to better outcomes overall.
How to make the most out of quantitative testing
Making the most of quantitative testing typically involves following specific best practices. First, it’s critical to understand the functional differences between quantitative and qualitative testing. Each strategy has a unique purpose and goal, and determining which approach is ideal for a specific situation isn’t always possible if researchers don’t understand how the two differ.
Quantitative methods also require a specific goal. Broad exploration is often too cumbersome, as the number of associated KPIs and needed data points is simply too expansive to make such strategies effective. Instead, focusing on a limited scope allows the selected tasks or survey questions to concentrate on a particular area, making the test more effective for gathering information that relates to a specific objective.
Similarly, simplification is often crucial when designing quantitative tests. Users need to have one clear instruction to follow or question to answer. If the instructions are cumbersome or wordy, confusion is more likely. Similarly, a multi-faceted question might be harder to understand, which could lead to responses that don’t reflect the user’s actual perspective.
With quantitative testing, having large sample sets is usually a must. Typically, the aim is to identify broad patterns within the target audience. If the sample size isn’t large enough, any resulting data may not reflect the genuine trends, or at least diminish the overall accuracy.
Finally, focus on quality when choosing study participants. Usually, this means developing a clear persona map that represents a target audience, leading to specific parameters when selecting individuals to take part. By using personas as guides, it’s easier to collect data that genuinely aligns with the target audience, creating more meaningful results.
Key takeaways
Ultimately, quantitative testing is incredibly valuable in the world of product and service development, including UI and UX design. With quantitative testing, it’s possible to identify patterns that reflect majority sentiments, highlight usability issues, and compare solutions to those of competitors.
Often, by using several quantitative methods, collecting valuable data that can drive smart decision-making is far simpler. Plus, it can help eliminate subjectivity that may steer a product or service in the wrong direction.
However, it’s critical to acknowledge the shortcomings of quantitative research. By doing so, further qualitative tests can be developed that offset the drawbacks of quantitative approaches. This will ensure that the right supplemental information is gathered, dramatically increasing the odds of overall success.

The EPAM Anywhere Editorial Team is an international collective of senior software engineers, managers and communications professionals who create, review and share their insights on technology, career, remote work, and the daily life here at Anywhere.
The EPAM Anywhere Editorial Team is an international collective of senior software engineers, managers and communications professionals who create, review and share their insights on technology, career, remote work, and the daily life here at Anywhere.
Explore our Editorial Policy to learn more about our standards for content creation.
read more


