


The following questions and answers have been reviewed and verified by Jakub Hanzel, Senior Web & Digital Analyst at EPAM Anywhere. Thanks a lot, Jakub!
Preparing for a web analyst interview can be a daunting task. The role of a web analyst is interdisciplinary, requiring a deep understanding of web analytics tools, data interpretation, strategic thinking, etc. The ability to use SQL or Python is becoming more and more required. To help you navigate your upcoming interview, we've compiled a comprehensive list of web analyst interview questions.
These web analyst interview questions and answers cover various topics, from technical aspects of web analytics to strategic and problem-solving ones, team cooperation and independent work. Whether you're a seasoned web analyst or just starting in the field, these questions will help you prepare and showcase your skills and knowledge to the interviewer.
1. What is the role of a web analyst in a project?
Main areas of web analysts' work include:
- Identifying business questions and requirements gathering
- Transferring requirements to technical language
- Collecting data by implementation tracking
- Processing data
- Analyzing data
- Visualizing and presenting data
A web analyst also collaborates with different teams, such as marketing, design, and development, to implement data-driven decisions and optimize the overall website performance. For this reason, communication skills and a clear comprehension of requirements are very important for the candidate.
2. How do you ensure data accuracy in web analytics?
Ensuring data accuracy in web analytics involves several steps:
- Implement a robust tracking setup: Ensure that you have installed the tracking code on all website pages and that all relevant events and goals are being tracked.
- Use filters and segments: Apply filters and segments to exclude irrelevant data, such as internal traffic, bots, and spam.
- Regularly audit and validate data: Periodically review the data to identify any discrepancies or issues and take corrective actions.
- Use multiple data sources: Cross-reference data from different sources to validate the accuracy of the data.
- Train team members: Educate team members on the importance of data accuracy and best practices for data collection and analysis.
- Cleanse and standardize data: Cleanse and normalize the data to ensure consistency and accuracy.
- Define data quality metrics: Determine the metrics and criteria that define data quality for a specific project or context.
3. What are some common web analytics tools and platforms?
Some common web analytics tools and platforms include:
- Google Analytics: A widely-used web analytics platform that provides insights into website traffic, user behavior, and conversions.
- A tag management system (TMS) is a software platform that allows businesses to manage and deploy various tracking tags and code snippets on their websites or mobile apps. An example of this system is Google Tag Manager.
- Google BigQuery is a fully-managed, serverless data warehouse and analytics platform provided by Google Cloud. It is designed to handle and analyze large volumes of data quickly and efficiently.
- Looker Studio, a visualization tool, enables users to connect to various data sources, transform and model the data, create visually appealing reports, and share them with others.
- Adobe Analytics is a comprehensive web analytics solution that offers advanced segmentation, real-time analytics, and predictive analytics capabilities.
- Mixpanel is a user-centric analytics platform that tracks user interactions and events within a website or application.
- Heap is an analytics tool that automatically captures all user interactions on a website, allowing for in-depth analysis without manual event tracking.
- Hotjar is a qualitative analytics tool that provides heatmaps, session recordings, and user feedback to help understand user behavior and improve user experience.
- Amplitude is a product analytics platform that helps companies analyze user behavior and track key metrics to inform data-driven decision-making.
- Matomo is an open-source web analytics platform that provides insights into website traffic and user behavior. It offers a self-hosted solution, allowing organizations full control over their data and compliance with data privacy regulations.
- A cookies management system (CMP) is a software solution or platform that allows organizations to manage and control the use of website cookies efficiently. Examples of this system are Cookiebot or OneTrust.
tired of job hunting?
Scroll no more. Send us your CV and we'll match it with our best remote web analyst jobs for you.
4. How do you add a Google Analytics 4 event to Google Tag Manager?
To add a Google Analytics 4 event to Google Tag Manager, follow the steps below:
- Log in to your Google Tag Manager account and select the appropriate container you want to work with.
- In the GTM dashboard, navigate to the "Tags" section.
- Click on the "New" button to create a new tag.
- Name your tag appropriately for identification purposes.
- Under the "Tag Configuration" section, click on the "Choose tag type" field and select "Google Analytics: GA4 Event" from the available options.
- If you want to track additional parameters with your event, you can configure them as well. Just add custom event parameters and add variables.
- Under the "Triggering" section, specify when the tag should be triggered. This could be based on a click, form submission, page load, or custom trigger conditions.
- Save the tag.
- Go to the GTM dashboard and click on "Submit" in the upper-right corner to deploy the changes.
- Once the changes are deployed, the tag will be live and start tracking the specified event in Google Analytics 4.
Additionally, it's essential to thoroughly test the tag to ensure it's firing correctly and sending the desired data to Google Analytics 4 before deploying it to a live website.
5. What key performance indicators (KPIs) can a web analyst track?
The selection of KPIs should always closely align with the business needs. KPIs will significantly differ depending on the business model. Whether it's ecommerce, lead generation, or an application, each of them can have completely different KPIs, but also many similarities.
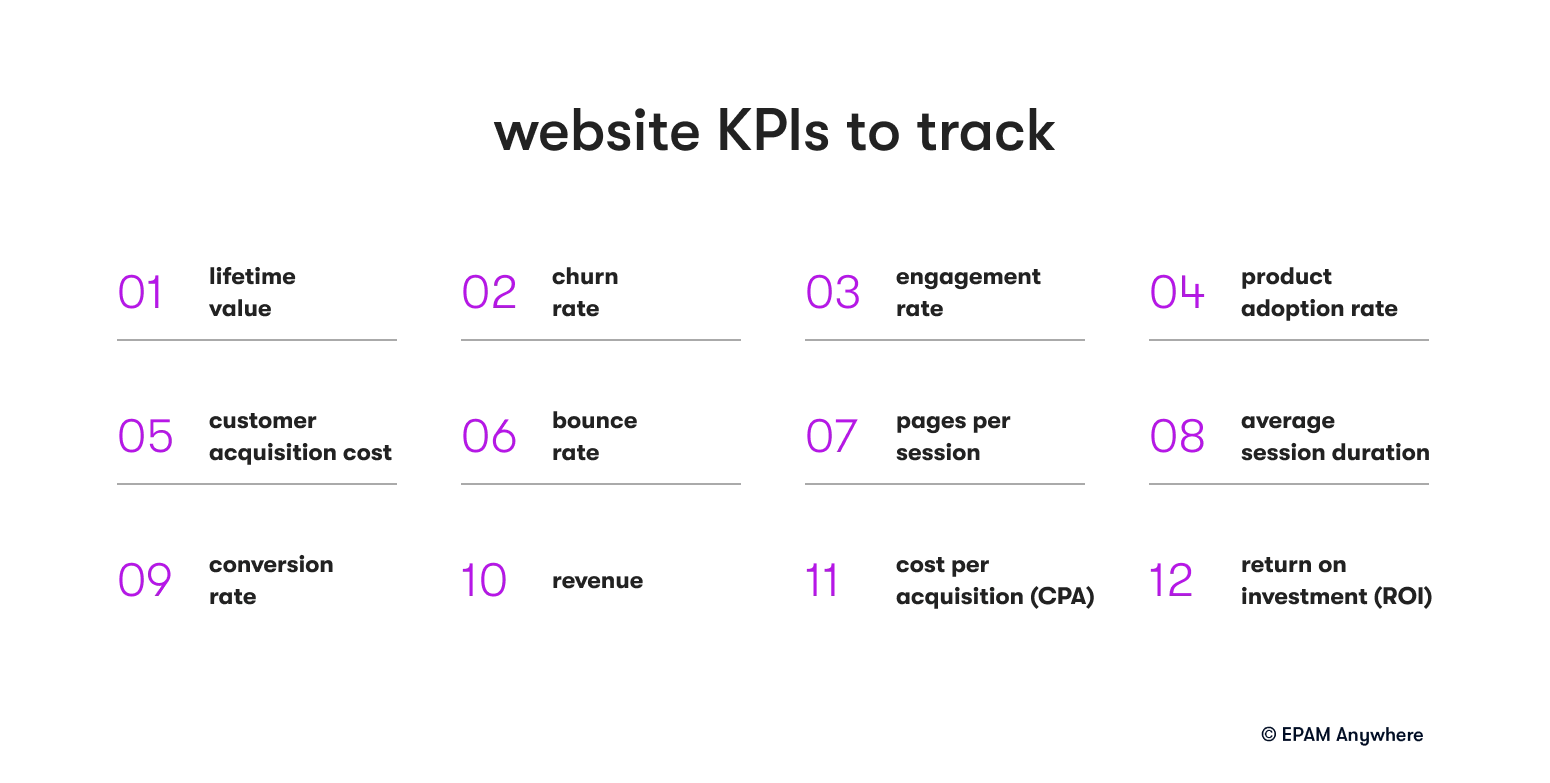
Some key performance indicators (KPIs) for a web analyst to track include:
- Lifetime value (LTV), which is a metric commonly used in business and marketing to evaluate the overall value of a customer throughout their entire relationship with a company.
- Churn rate is a metric used to measure the rate at which customers or subscribers discontinue their relationship with a company over a specific period of time. It represents the percentage of customers or subscribers who stop using a product or service within a given timeframe.
- Engagement rate refers to a metric that measures the level of user engagement with your website or app. It indicates the proportion of engaged sessions or users out of the total sessions or users.
- Product adoption rate is a metric used to measure the rate at which customers or users adopt and start using a particular product or service. It provides insights into the speed and extent to which customers embrace a new offering.
- Customer acquisition cost (CAC) It is a metric that measures the average cost a business incurs to acquire a new customer. CAC takes into account the total marketing, sales, and operational expenses associated with acquiring customers over a specific period.
- Bounce rate: The percentage of single-page sessions where users leave the website without interacting with other pages or elements.
- Pages per session: Average number of pages viewed per session.
- Average session duration: The average time users spend on your website.
- Conversion rate: How many people complete an action or goal, such as purchasing, signing up for a newsletter, or filling out a contact form.
- Revenue: The total income generated from website transactions, including product sales, subscriptions, and advertising revenue.
- Cost per acquisition (CPA): Cost per lead or customer acquired through marketing.
- Return on investment (ROI): Measures the effectiveness of marketing campaigns based on the net profit divided by total marketing expenses.

6. How do you analyze and optimize a website's conversion funnel?
To analyze and optimize a website's conversion funnel, follow these steps:
- Identify the key steps in the conversion process, such as landing pages, product pages, shopping carts, checkout or forms
- Set up conversion and funnels in your web analytics tool to track user progress.
- Analyze funnel performance to identify drop-off points and areas for improvement.
- Use A/B and multivariate testing to experiment with different design elements, content, calls to action and recommendation engine (upsell and cross-sell) to improve conversion rates at each funnel step.
- Monitor and study the results of your tests to determine the most effective changes and implement them on your website.
- Iterate and optimize the conversion funnel based on data-driven insights and user feedback.
Always remember to consider that the A/B test is statistically significant, meaning that the difference in results is likely due to the changes made in the variants rather than random fluctuations in the data.


7. What is the difference between first-party and third-party cookies in web analytics?
First-party cookies are generated and tracked by the website the user is visiting. They are used to store information about the user's preferences, login status, and browsing history on that specific website. First-party cookies are more secure and privacy-friendly, as they can only be accessed by the domain that created them.
Third-party cookies, however, are created and stored by a domain different from the one the user is visiting. Advertising networks and other third-party services typically use them to track user behavior across multiple websites and serve targeted ads. Third-party cookies have been criticized for their potential privacy implications, so many web browsers have blocked them by default.
8. How do you use segmentation in web analytics?
In web analytics, segmentation refers to dividing your website's audience into smaller groups based on specific characteristics, such as demographics, behavior, or traffic sources. It allows you to analyze and compare performance across segments and identify trends, patterns, and optimization opportunities. Segmentation can also be used in marketing campaigns for targeting users.
To use segmentation in web analytics:
- Identify the criteria for segmentation, such as age, gender, location, device type, traffic source, or user behavior (e.g., new vs. returning users, high vs. low engagement).
- Create segments in your web analytics tool or data warehouse based on the chosen criteria.
- Analyze each segment’s performance in key metrics, such as traffic, bounce rate, conversion rate, and revenue.
- Compare the performance of different segments to determine areas for improvement and optimization.
- Implement targeted marketing strategies and website optimizations to address each segment's needs and preferences.

9. What is A/B testing, and how can it be used in web analytics?
In A/B testing, or split testing, two or more versions of a web page, design element, or marketing campaign are compared to determine the most effective one. In an A/B test, users are randomly assigned to one of the test variations, and their behavior is tracked and analyzed to determine the effectiveness of each version in terms of key performance indicators (KPIs), such as conversion rate, click-through rate, or time on page.
A/B testing can be used in web analytics to:
- Test design elements like headlines, images, colors, and calls to action to determine which resonates best with your audience.
- Determine the most effective approach for engaging users and driving conversions by experimenting with different content types, formats, and messaging.
- Test the recommendation engine algorithm.
- Optimize landing pages, product pages, and other key steps in the conversion funnel to improve user experience and conversion rates.
- Evaluate the performance of different marketing campaigns, such as email, social media, and paid search, to determine the most effective channels and strategies for driving traffic and conversions.
10. What are some common challenges web analysts face, and how can they be addressed?
Some common challenges faced by web analysts include:
- Data accuracy and reliability: Ensuring the accuracy and reliability of web analytics data can be challenging due to issues such as tracking code errors, data sampling, and bot traffic. To address this, implement a robust tracking setup, use filters and segments to exclude irrelevant data, and regularly audit and validate your data.
- Data overload: Web analysts often have access to a vast amount of data, which can be overwhelming and make it difficult to identify actionable insights. To overcome this, focus on key performance indicators (KPIs) that align with your business objectives and use segmentation and visualization tools to simplify data analysis.
- Keeping up with technology and industry trends: The web analytics landscape constantly evolves, with new tools, platforms, and best practices emerging regularly. To stay up-to-date, invest in ongoing professional development, attend industry conferences and webinars, and participate in online forums and communities.
- Cross-functional collaboration: Web analysts often must collaborate with different teams, such as marketing, design, and development, to implement data-driven decisions and optimizations. To facilitate effective collaboration, develop strong communication skills, establish clear processes and workflows, and foster a data-driven culture within your organization.
- The most demanding aspect of being an analyst is the versatility of knowledge they must possess and the constant adaptation to the changing reality and market demands.
11. How do you measure the success of a web analytics project?
To measure the success of a web analytics project, consider the following factors:
- Alignment with business objectives: Ensure the web analytics project addresses specific business objectives, such as increasing revenue, improving user experience, or optimizing marketing campaigns.
- Key performance indicators (KPIs): Define and track relevant KPIs to measure the impact of the web analytics project on website performance, user behavior, and marketing outcomes.
- Actionable insights: Evaluate the extent to which the web analytics project has generated actionable insights that have led to data-driven decisions and optimizations.
- Return on investment (ROI): Calculate the ROI of the web analytics project by comparing the net profit generated by the project (e.g., through increased revenue, cost savings, or improved efficiency) to the total cost of the project (e.g., tool subscriptions, personnel costs, and training expenses).
- Stakeholder satisfaction: Gather feedback from stakeholders, such as team members, management, and clients, to assess their satisfaction with the web analytics project and its outcomes.


12. How do you ensure data privacy and compliance with regulations such as GDPR and CCPA in web analytics?
To ensure data privacy and compliance with regulations such as GDPR (General Data Protection Regulation) and CCPA (California Consumer Privacy Act) in web analytics:
- Obtain user consent: Inform users about the data you collect and how it will be used, and obtain their consent before collecting any personal data.
- Anonymize data: Use techniques such as IP anonymization and data aggregation to protect user privacy and minimize the risk of data breaches.
- Limit data collection and retention: Collect only the data necessary for your analytics purposes and establish retention policies to delete old or unnecessary data.
- Implement data security measures: Use encryption, access controls, and other security measures to protect the data you collect and store.
- Conduct privacy impact assessments: Regularly assess the privacy risks associated with your web analytics activities and implement measures to mitigate those risks.
- Train team members: Educate your team members on data privacy best practices and the requirements of relevant regulations.
- Stay up-to-date with regulatory changes: Monitor changes in data privacy regulations and update your policies and practices accordingly.
13. How do you present web analytics data and insights to non-technical stakeholders?
To present web analytics data and insights to non-technical stakeholders:
- Focus on key metrics and insights: Highlight the most important metrics and insights that align with the stakeholders' interests and business objectives.
- Use clear and concise language: Avoid technical jargon and explain complex concepts in simple, easy-to-understand terms.
- Visualize data: Use charts, graphs, and other visual aids to make the data more accessible and engaging.
- Tell a story: Present the data and insights in a narrative format that connects the dots and demonstrates the impact of your web analytics efforts on the business.
- Provide actionable recommendations: Offer specific, data-driven recommendations for improving website performance, user experience, and marketing outcomes.
- Be prepared to answer questions: Anticipate potential questions from stakeholders and provide additional context and explanations as needed.
- Follow up: Share the results of any implemented recommendations and continue to provide updates on the progress of your web analytics efforts.
14. How do you identify and analyze the performance of different traffic sources in web analytics?
To identify and analyze the performance of different traffic sources in web analytics, follow these steps:
- Categorize traffic sources: Group your website traffic into categories, such as organic search, paid search, social media, email, referrals, and direct traffic.
- Use UTM parameters: Add UTM parameters to your marketing campaign URLs to track the performance of specific campaigns and traffic sources in your web analytics tool.
- Analyze traffic volume: Compare the number of visitors, sessions, and pageviews generated by each traffic source to identify the most popular channels and potential areas for growth.
- Evaluate user engagement: Analyze engagement metrics, such as bounce rate, pages per session, and average session duration, to determine the quality of traffic from each source.
- Track conversions and revenue: Monitor each traffic source's conversion rate, revenue, and other goal-related metrics to evaluate their impact on your business objectives.
- Calculate return on investment (ROI): Compare the revenue generated by each traffic source to the associated marketing costs to determine the ROI and effectiveness of your marketing efforts.
- Optimize marketing strategies: Use the insights gained from your traffic source analysis to optimize your marketing strategies, such as allocating more budget to high-performing channels, improving targeting and messaging, and testing new marketing tactics.
- Adopt modeling attribution: In marketing, this involves assigning credit or determining the contribution of various marketing touchpoints or channels in driving desired customer actions, such as conversions or sales. It aims to understand which marketing efforts or touchpoints are most effective in influencing customer behavior and driving desired outcomes.

15. What is cohort analysis, and how can it be used in web analytics?
Cohort analysis analyzes user behavior by grouping users into cohorts based on a shared characteristic, such as the date they first visited your website, the marketing campaign that brought them to your site, or the product they purchased. By comparing the behavior of different cohorts over time, you can identify trends, patterns, and opportunities for optimization.
Cohort analysis can be used in web analytics to:
- Evaluate the effectiveness of marketing campaigns: Compare the performance of users acquired through different marketing campaigns in terms of engagement, conversion rate, and revenue.
- Analyze user retention and churn: Track the percentage of users who continue engaging with your website or product over time and identify factors contributing to retention or churn.
- Assess the impact of product updates or website changes: Compare the behavior of users who experienced a specific product update or website change to those who did not to determine the impact of the change on user behavior and satisfaction.
- Identify high-value customer segments: Analyze the behavior of different customer segments, such as users who make repeat purchases or spend above a certain threshold, to identify high-value customers and tailor your marketing and product strategies to their needs and preferences.
- Optimize user onboarding and customer journey: Compare the behavior of cohorts who completed different onboarding steps or followed different customer journeys to identify areas for improvement and optimization.
16. What are JOINS and their types in SQL?
In SQL, JOIN is used to combine records from two or more tables based on a related column between them. There are several types of JOINs commonly used in SQL:
- INNER JOIN: Returns records that have matching values in both tables being joined. It only includes the matched rows.
- LEFT JOIN (or LEFT OUTER JOIN): Returns all records from the left table and the matched records from the right table. If there is no match, NULL values are returned for the right table.
- RIGHT JOIN (or RIGHT OUTER JOIN): Returns all records from the right table and the matched records from the left table. If there is no match, NULL values are returned for the left table.
- FULL JOIN (or FULL OUTER JOIN): Returns all records when a match is in either the left or right table. NULL values are returned for the non-matching side if there is no match.
- CROSS JOIN: Returns the Cartesian product of the two tables, i.e. all possible combinations of rows from both tables.
These JOIN types allow for more flexible querying by connecting related data from different tables based on common columns.
17. What is Google Tag Manager, and what does the configuration of a simple tag look like?
Google Tag Manager (GTM) is a tool provided by Google that allows businesses to manage and deploy various tracking codes and tags on their websites or mobile apps without the need for manual code implementation. It simplifies adding and updating tags, such as analytics tags, conversion tracking tags, remarketing tags, and more.
A simple tag configuration in Google Tag Manager typically consists of the following components:
- Tag name: A descriptive name given to the tag for easy identification within GTM.
- Tag type: Specifies the type of tag to be implemented, such as Google Analytics, Facebook Pixel, or any other third-party or custom tag.
- Trigger: Determines when and where the tag will be fired. It defines the specific conditions that must be met before the tag is executed. Triggers can be set based on events, pageviews, clicks, form submissions, and more.
- Variables: Variables provide dynamic values that can be used in the tag configuration. They can be predefined variables, such as page URL or referring URL, or custom variables based on specific data you want to capture from your website.
- Tag configuration: This section varies depending on the selected tag type. It includes settings and parameters specific to the chosen tag, such as the tracking ID for Google Analytics or the pixel ID for Facebook Pixel.
By configuring these elements in Google Tag Manager, businesses can easily deploy and manage various tracking tags on their websites while having more flexibility and control over their online tracking and analytics.
18. Provide several methods of cooperation with the client that allow you to prepare a measurement plan
There are several methods of cooperation with clients that can help in preparing a measurement plan:
- Initial consultation: Schedule an initial meeting or consultation with the client to understand their business goals, objectives, and key performance indicators (KPIs). This will help in identifying what needs to be measured and tracked.
- Requirement gathering: Work closely with the client to gather specific requirements for tracking and measurement. This includes identifying the metrics and dimensions to track, defining conversion goals, and understanding the target audience.
- Collaborative workshops: Organize workshops or brainstorming sessions with the client's team to align on measurement goals and objectives. This allows for a collaborative approach in building a measurement plan and ensures all stakeholders are involved.
- Documentation review: Request any relevant documentation, such as business plans, marketing strategies, or reports, to get a deeper understanding of the client's business and identify areas that require tracking and measurement.
By utilizing these methods, you can establish a collaborative and effective approach to prepare a measurement plan that aligns with the client's objectives and provides valuable insights for their business.
19. Which types of A/B tests do you know?
There are several types of A/B tests commonly used in experimentation:
- A/B/n test: This type of test compares more than two variants. It involves randomly dividing the audience into multiple groups, each exposed to a different variant (A, B, C, etc.), and measuring the performance of each variant.
- Split URL test: In this test, different versions of a webpage or website are hosted on separate URLs. Visitors are randomly assigned to a variant and directed to the corresponding URL. Performance metrics are then compared across the different URLs.
- Multivariate test: This type of test involves testing multiple variations of multiple elements on a webpage simultaneously. It allows for testing numerous combinations of changes and their impact on overall performance.
- Sequential A/B test: In certain cases, it might be more practical or insightful to conduct an A/B test sequentially, where one variant is tested against the baseline (control) initially. If the initial variant shows promising results, it can then be further optimized or compared to additional variants.


Conclusion
In conclusion, mastering these web analyst interview questions can seriously increase your chances of acing your interview and landing your dream job.
At EPAM Anywhere, we understand the importance of this role and offer exciting remote web analyst jobs. You can leverage your skills and knowledge while enjoying the flexibility and comfort of working from home.
With EPAM Anywhere, you'll be part of a diverse team of professionals working on challenging projects for global clients. So, if you're ready to take your web analyst career to the next level while enjoying the benefits of remote work, explore the opportunities at EPAM Anywhere today.

With a focus on remote lifestyle and career development, Gayane shares practical insight and career advice that informs and empowers tech talent to thrive in the world of remote work.
With a focus on remote lifestyle and career development, Gayane shares practical insight and career advice that informs and empowers tech talent to thrive in the world of remote work.
Explore our Editorial Policy to learn more about our standards for content creation.
read more


